This post is a selection of insights from our reports to subscribers this week, showcasing how we build the contextual framework to find daily trade ideas. This is a repeatable process aimed at finding high-risk-reward trades. Note that the onus is on the subscriber to pick and choose which trades fit their overall risk.
In this week’s blog post, as part of the trade ideas shared with subscribers, we delved into owning HYG downside – funded by TLT put spreads – , longer dated call spreads to play a Chinese stocks rally, and adding Oil sector exposure at lower levels given the elevated skew in XLE compared to other sectors.
For a deeper dive into how I structure my trade ideas and to learn my thorough process, join our next Free Options Trading Webinar.
Owning HYG Downside
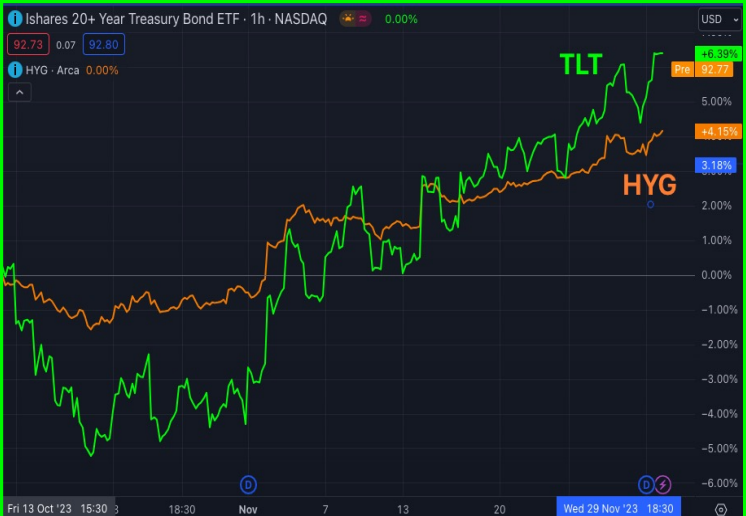
As rates expectation plummeted on the back of falling inflation data and dovish comments from FED speakers, we saw treasuries and risk assets rally strongly. The soft-landing scenario has therefore been gaining traction and vol in assets like HYG has collapsed.
If growth data were to roll over faster than expected and stock-bond correlation goes negative (with lower inflation) then we would expect HYG to sell off with stocks whilst treasuries are more resilient. This type of price action is what we tend to see in deflationary regimes like March 2020.
Snapshot of the TLT vs HYG charts:
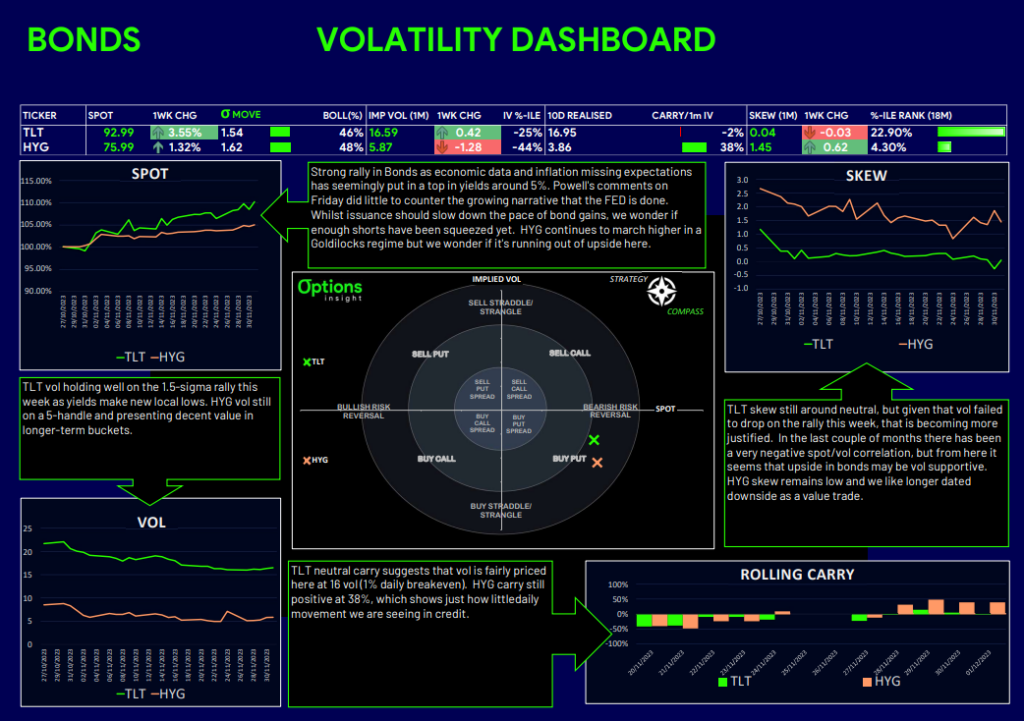
What’s interesting is that when we compared the 3m downside implied vol on TLT and HYG, we saw that the ratio was trading in the 95th percentile going back 5 years. This was testament to the flat skew in HYG and the relatively elevated treasury vol.
Another key point here is correlation. When inflation is high, and stocks and bonds are correlated, then HYG also has higher correlation to TLT. However, in a growth shock scenario, this correlation would likely flip and HYG vol would increase on the way down, but treasuries may rally at the same time.
Snapshot of the TLT vs HYG Vol Dashboard:
Interested in learning the process/tools I follow, from thesis to trade idea? Join our next Free Options Trading Webinar.
There are multiple outcomes where owning HYG downside, funded by TLT put spreads can make money. The one main negative scenario would be growth beats expectations causing stocks and credit to keep grinding higher and bonds sell off due to a more resilient economy.
Don’t forget, as a subscriber, you gain exclusive access to tools that reveal the specifics of this daily trade idea via the Macro Options Daily report.
Call Spreads on Chinese Stock Index
Last week we flagged that China was getting interesting as stocks kept falling as the economy falters and sentiment among investors got extremely weak.
The delay in the third plenum seems to have been taken badly and even though we’ve seen signs of the regulatory cycle turning more towards support for the economy and the property sector, investors still appear to be cautious into year end. We do see potential for a turn in sentiment next year if they can achieve growth targets of around 5%, whilst the rest of the world is slowing down.
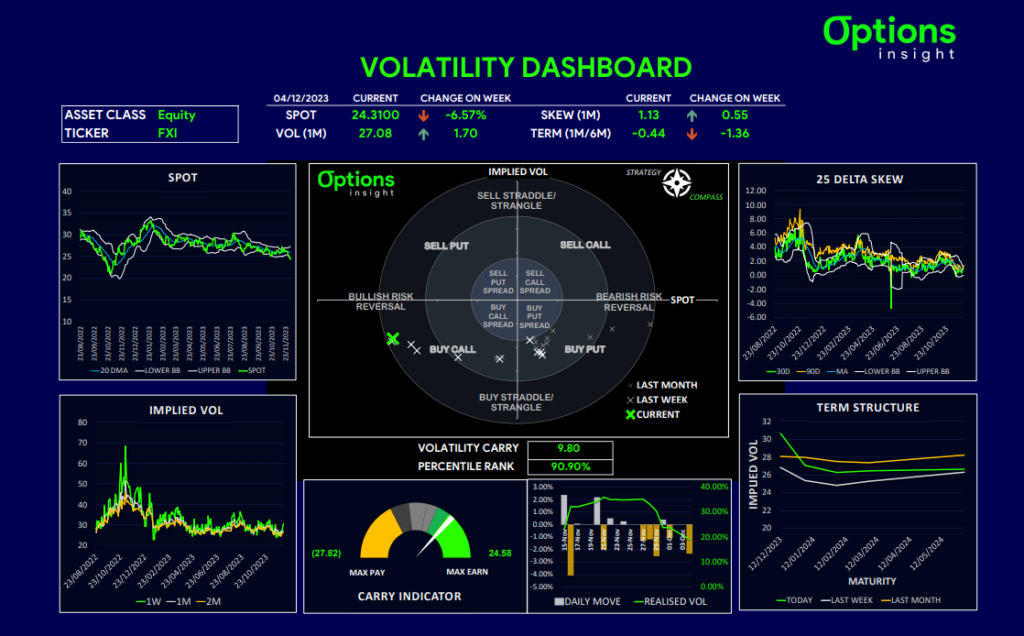
Chart of the FXI:
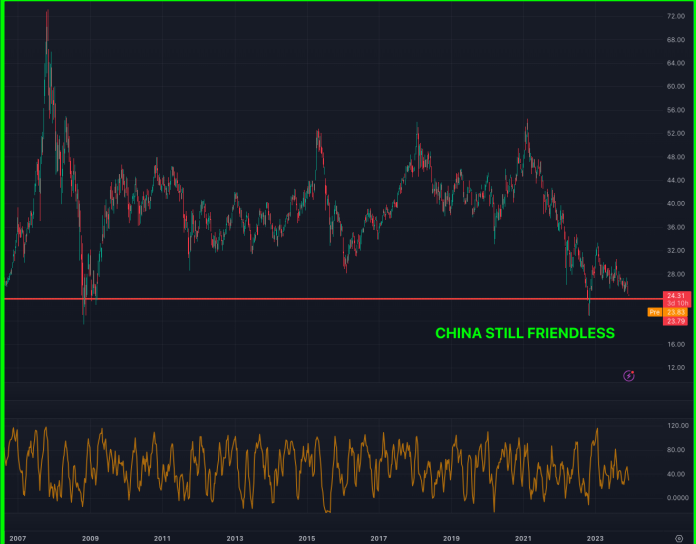
Looking at where vol and spot are in China, we think longer dated (6 month) call spreads are the better way to express long DELTA views. With the skew quite flat and vol not quite on the lows, we prefer to use call spreads rather than calls. This way we can use a longer maturity and keep the THETA decay bill down.
Snapshot of FXI Vol Dashboard:
Interested in learning the process/tools I follow, from thesis to trade idea? Join our next Free Options Trading Webinar.
At these beaten up spot levels, we see value in scaling into long DELTA, provided it doesn’t decay too fast. If we were to get a bounce in short order and a pop in front end vol, we may then be able to sell short dated calls to get some more premium back. The risk/reward on these call spreads is around 7 to 1.
Don’t forget, as a subscriber, you gain exclusive access to the specifics of this daily trade idea via the Macro Options Daily report.
Adding Oil Sector Exposure
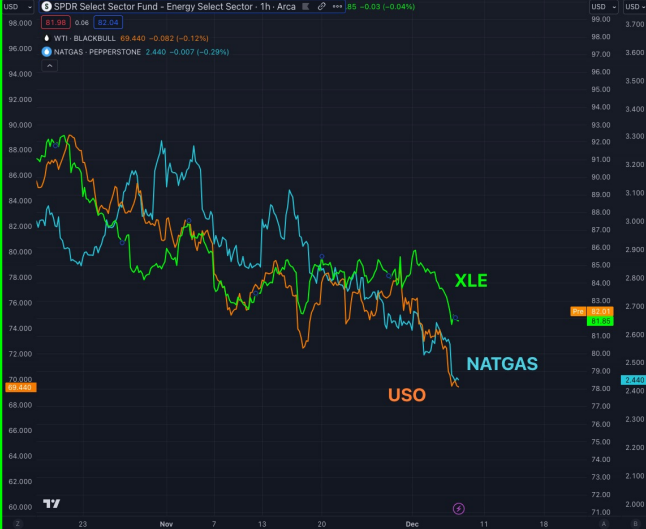
Energy commodities were hammered lately and while they seem to be accelerating to the downside, the Oil stocks are not trading as badly, suggesting some downside exhaustion.
For those comfortable adding Oil sector exposure at lower levels should consider using options structures
that take advantage of the more elevated skew in XLE compared to other sectors.
We see the 80 level as the first support zone and below that 77 is much stronger. Underwriting using puts for those who are happy to allocate 5% lower makes sense.
Chart of energy tickers:
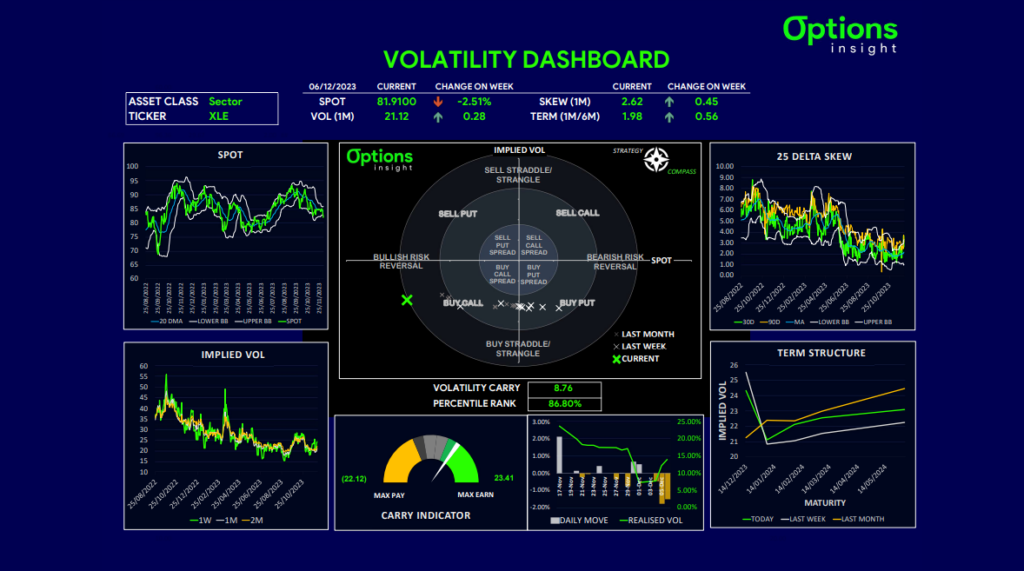
Strategy compass shows spot oversold and vol still slightly elevated with positive vol carry. This makes us not want to buy outright calls and rather fund some upside with short puts.
This trade only makes sense for those happy to take delivery of the asset at the lower strike.
Snapshot of XLE Vol Dashboard:
Interested in learning the process/tools I follow, from thesis to trade idea? Join our next Free Options Trading Webinar.
———
Remember, not only do I share these trade ideas, but the ones I end up adding to my portfolio, are then tracked via a 20-30m weekly webcast that gives in-depth guidance. In it, you get to learn how to break down options trades by their Greeks and restructure trades in an optimal way to meet desired investment goals in real time. This is part of our Macro Options Overlay.
And that’s a wrap for this week!
Remember, you now have a chance to build your knowledge base via our FREE Options Insight webinar!
You will learn the process and tools I follow, from thesis to trade idea and actual execution.
This is a unique chance to learn how to master simple options trading strategies straight from a 20+ year career.
Just click the link below!
Free Options Trading Webinar
σ
σ
Thank you for making it this far!
As always, if you have any questions, comments, and/or found this helpful, feel free to reach out and let us know at info@options-insight.com
Cheers!
Imran Lakha
Options Insight
