The 30-second symmetry check

Here's a check I run on any structure someone shows me. It takes about thirty seconds.
Pick a horizon. Say the next month or two.
Then ask two questions. If this rallies 10%, what do I make? If it sells off 10%, what do I lose?
If those two numbers are roughly the same, the structure is behaving like a delta trade wearing a costume. The optionality on the diagram is decorative. The Greeks are running a linear position.
Someone showed me a call fly recently. The 30-second check answer was make five hundred if it rallied ten percent, lose five hundred if it dropped ten percent. Symmetric.
However clever the strikes look on the diagram, for the next couple of months that position was doing what ten shares of stock would do. Just with more complexity, more theta, and a higher chance of the trader talking themselves out of it before anything interesting happened.
Here's the interesting part.
The asymmetry inside those structures is usually real. It just shows up late.
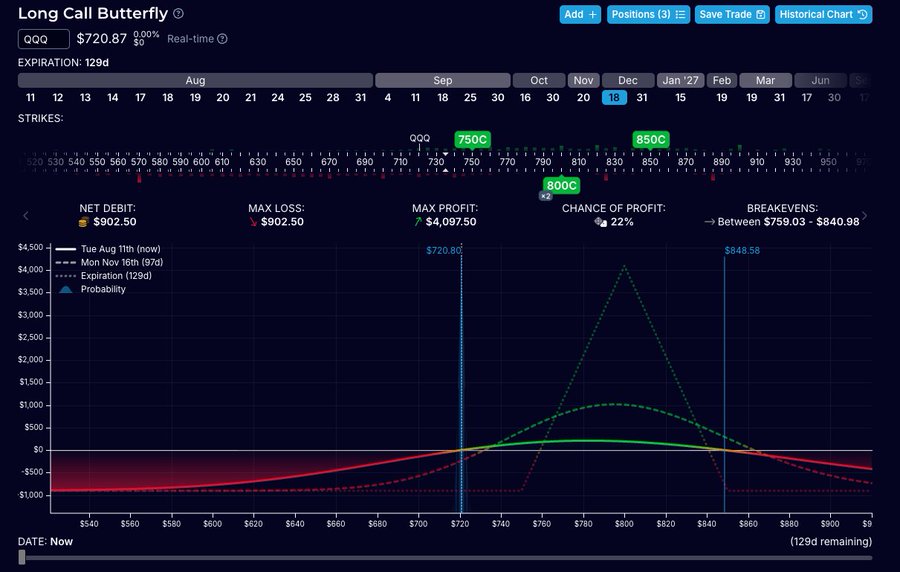
Run the same check on the same structure in the final two months of its life, and suddenly you're making three times what you'd lose. All the optionality that was invisible earlier was sitting at the back end the whole time.
That changes the real question.
The real question is timing. When does the asymmetry actually show up? A structure that only becomes asymmetric in its final two months is a delta trade for the first three-quarters of its life.
If you're planning to be out before the asymmetry arrives, you're buying optionality you never actually get to use. You may as well stick to trading shares. The complexity was theatre.
Running the 30-second symmetry check on every structure before you enter is exactly the kind of institutional discipline that separates a real options book from a stock book in disguise. The framework I built across 20 years on bank options desks is below.
Beyond the 30-second check.
Every options structure has a time profile for its Greeks. Delta, gamma, vega, theta. All of them evolve as the trade ages. A structure that looks static on the payoff diagram is doing very different things at different points in its life.
The payoff diagram shows only the terminal state. What matters for the actual trade is the interim state. Where the Greeks are between now and expiry. That gap is where stock-equivalent trades hide inside options wrappers.
Run the symmetry check. If the answer is symmetric, you don't have an options trade for the horizon you're actually holding.
If you want to skip the masterclass and jump straight into our course, the Options Insight Advantage, this is the link.


Imran
Disclaimer (Your Gains & Losses, Your Responsibility): This content from Options Insight LLC (“Options Insight”) is for educational purposes only and does not provide individual investment advice or recommendations, nor should it be considered an offer to buy or sell any security. All information is general and not tailored to your specific objectives, financial situation, or risk tolerance. Employees of Options Insight may hold positions in the assets discussed. While we use sources believed to be reliable, we are not responsible for errors, omissions, or losses resulting from reliance on this content. Always consult a licensed investment professional.
Liked this? Imran writes one every market day. Get them direct to your inbox.