This post is a selection of insights from my reports to subscribers this week, showcasing how I build the contextual framework to find daily trade ideas. This is a repeatable process aimed at finding high-risk-reward trades. Note that the onus is on the subscriber to pick and choose which trades fit their overall risk.
In this week’s blog post, I explored various trade ideas. One such idea was selling downside vol in $GLD via put ladder or condor structures. Another one was to gain upside exposure in Mexican equities via $EWW through call calendars. Being short gamma in financials ($XLF) also looked very attractive so that clients could find a smart way to earn theta. Lastly, I emphasized considering hedges as protection in the $SPX via put spreads for those in need, which still offers decent risk/reward.
For a deeper dive into how I structure my trade ideas and to learn my thorough process, join our next Free Options Trading Webinar.
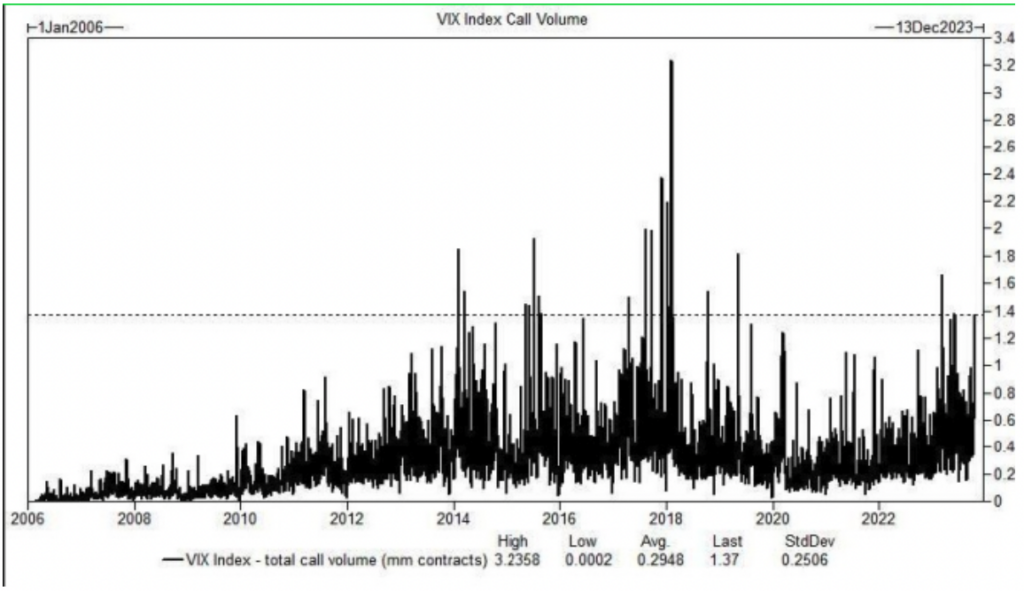
I felt it was important to start the week with the new vol regime context top of mind. Those following VIX understad that the index has a negative beta to the SPX, with its value directly related to the 1m ATM vol on SPX options. The previous week, especially on Friday, saw the VIX beta shift into high gear when the front-month VIX futures moved significantly more than the SPX’s fall would usually indicate.
This movement was an evident panic, a rush to buy war hedges over the weekend, prompted by fears of an escalation in the Middle East and potential widespread declines in risk assets. Demand wasn’t confined to VIX futures alone. VIX call option volumes had spiked to 1.4m, with investors buying calls and call spreads as hedges. Concurrently, the VVIX (implied volatility of VIX options) had risen nearly 20p.
Snapshot of SPY Vol Dashboard:
Interested in learning the process/tools I follow, from thesis to trade idea? Join our next Free Options Trading Webinar
Generally, sharp VIX movements of this nature should be faded. Employing VIX puts or put structures remains the safer approach for engaging in a trade that has historically proven successful most of the time.
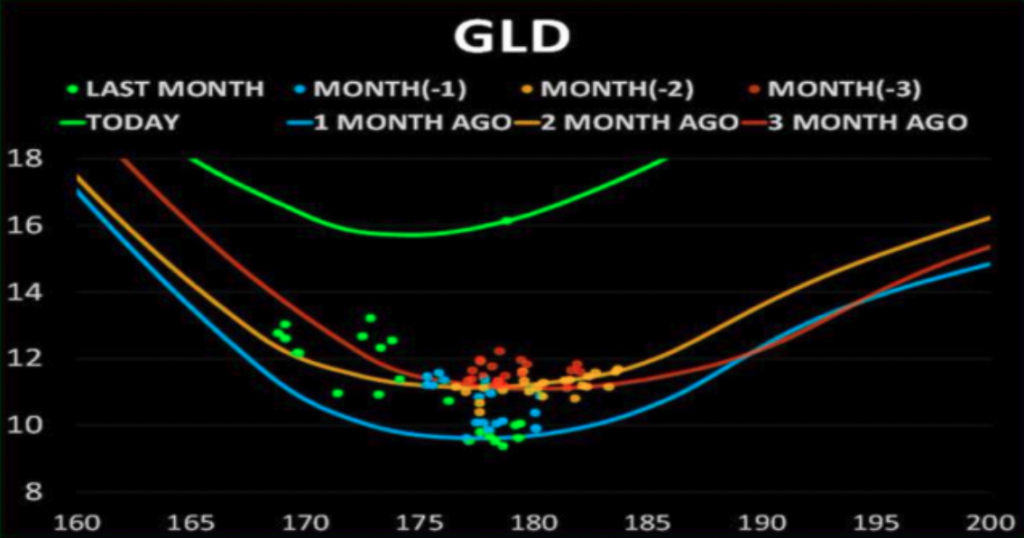
Before the conflict in the Middle East escalated, Gold had already bounced strongly from its weekly support near 1800 (168 on GLD). If you refer back to the previous blog post, you’d notice I proposed a long trade idea, which so far has fared incredibly well. The latest gap higher was from nervous investors reaching for geopolitical hedges, of which Gold is considered a favourite.
The sharp 3-sigma rally brought a huge vol and skew spike for calls, but put vols were also dragged higher. Any de-escalation and fading back in Gold prices will likely see vol get crushed back quickly. That’s why selling downside vol in Gold looked attractive.
Snapshot of Gold vol comparison:
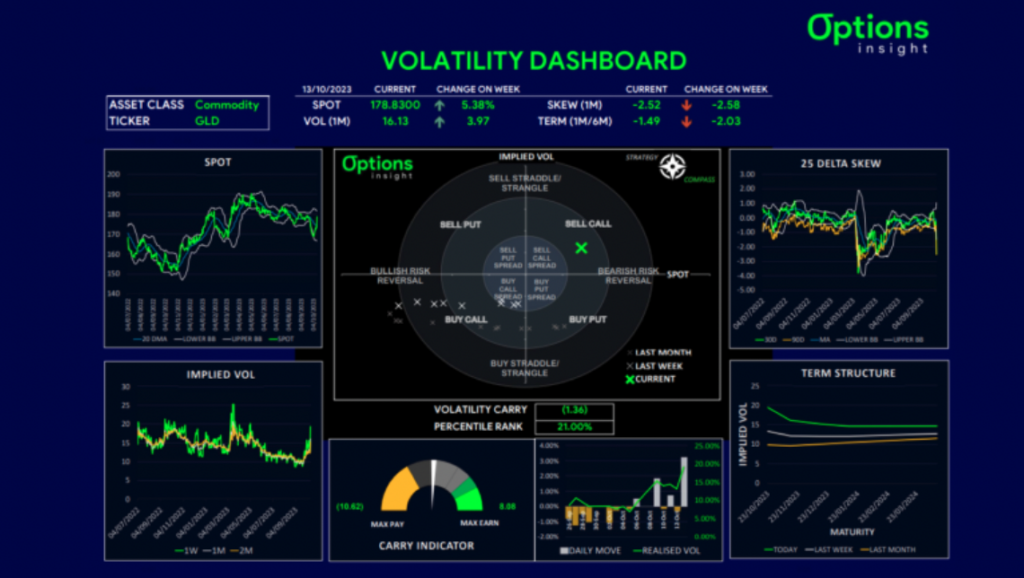
Our volatility dashboard showed that sell calls was the optimal trade in Gold, which makes sense if you are long the underlying and willing to overwrite some of your allocation. For more opportunistic trades, I preferred to sell the downside vol using put ladder or condor structures, because it’s very likely that if prices move back down, implied vol will too
Snapshot of $GLD Vol Dashboard:
Interested in learning the process/tools I follow, from thesis to trade idea? Join our next Free Options Trading Webinar
Despite a 20% pullback from its summer highs, Mexico remains one of the better international stock markets of the year. The central bank policy tweaks with regard to FX swaps caught investors off guard and triggered a repricing lower in the Peso.
This seems to have stabilized, and with more talk of the FED being finished hiking inflation, surprising to the upside in Mexico, the only thing holding up the dollar seems to be the geopolitical instability in the Middle East.
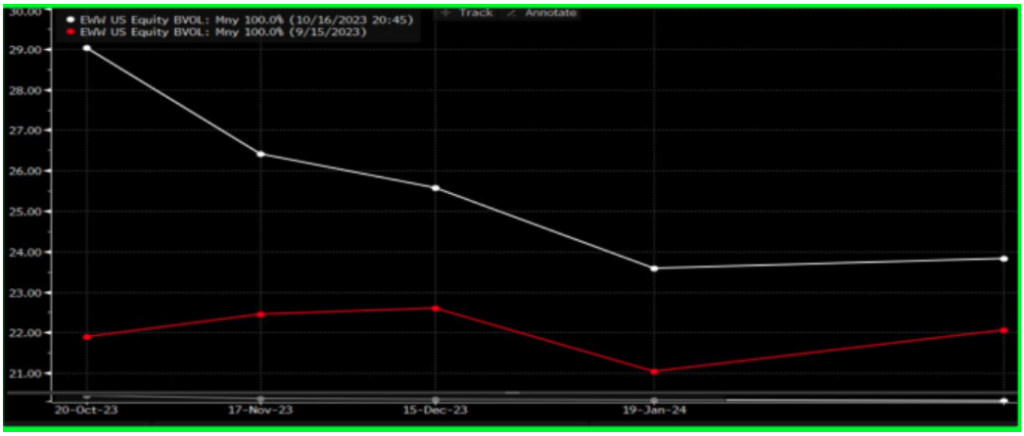
Snapshot of the Mexican stock market ($EWW) in purple:
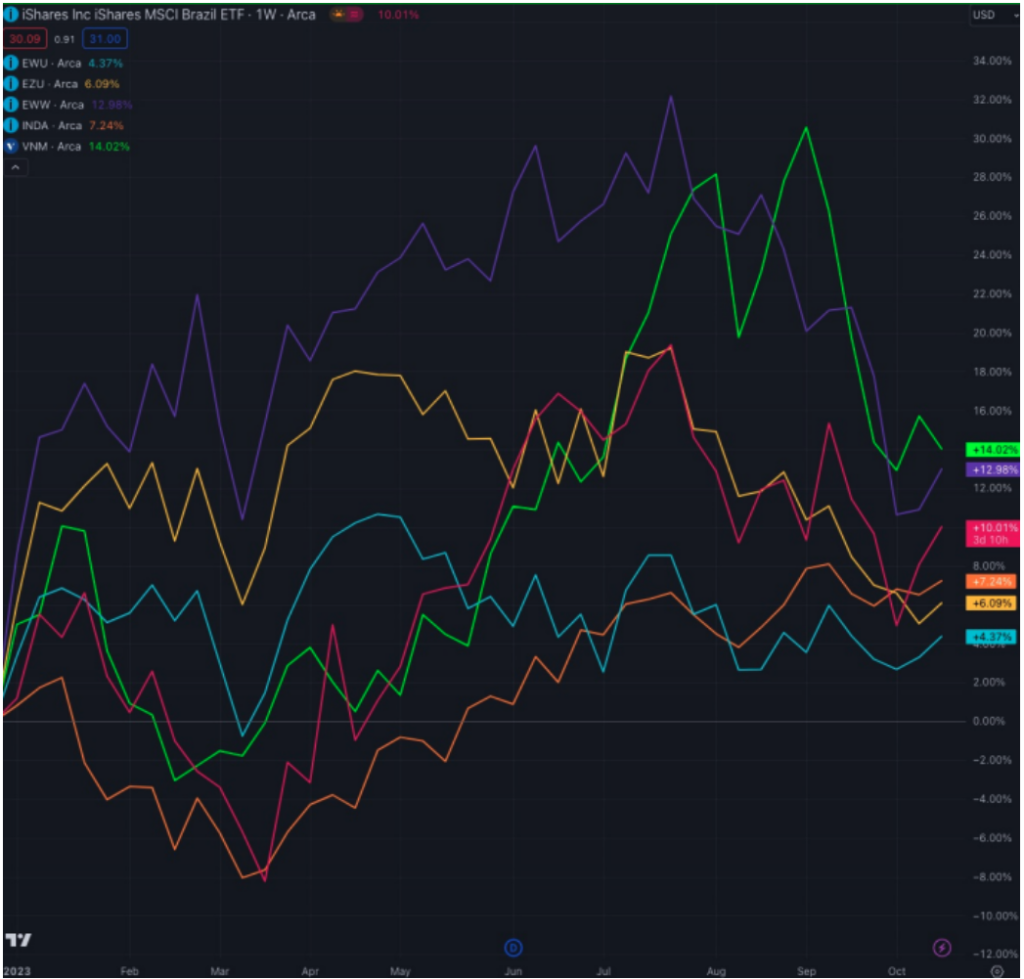
Once this tail risk subsides, we could see a move lower in the dollar, and EM currency strength can return. We saw de-risking of carry trades over September, but that now looks like it’s played out. I think EWW is primed to resume its uptrend once the dollar bid fades.
Given the drop in EWW over the last couple of months, we’ve seen the term structure invert, taking front-end vols into the high 20s. The curve shape lends itself well to call calendars that play a rally scenario into year-end, but allows investors to save premium and theta decay.
Snapshot of $EWW term structure:
Interested in learning the process/tools I follow, from thesis to trade idea? Join our next Free Options Trading Webinar
With many of the big banks having reported decent earnings but more cautious outlooks, we have not seen a huge move in the financials sector. It seems that the 3-4% rally from recent lows had already priced in some optimism, and with so many clouds of uncertainty around rates, inflation and the economy, the upside has been limited.
Snapshot of $XLF chart:
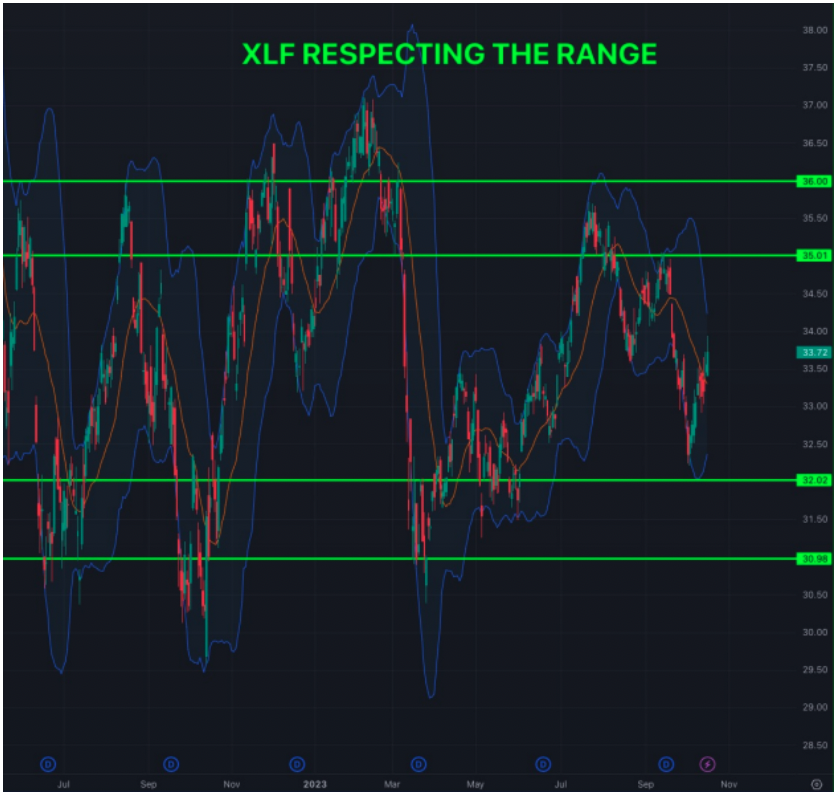
The broader market has had a nice recovery from September lows, and now we need the conflict in Israel to die down and volatility in rates and commodities to fade before the next leg of the rally in stocks can resume.
Tech earnings were always going to be a potential catalyst in either direction mid to late week, so a big delta bias here did not seem warranted. I instead looked for more delta-neutral ways to capture alpha in this environment.
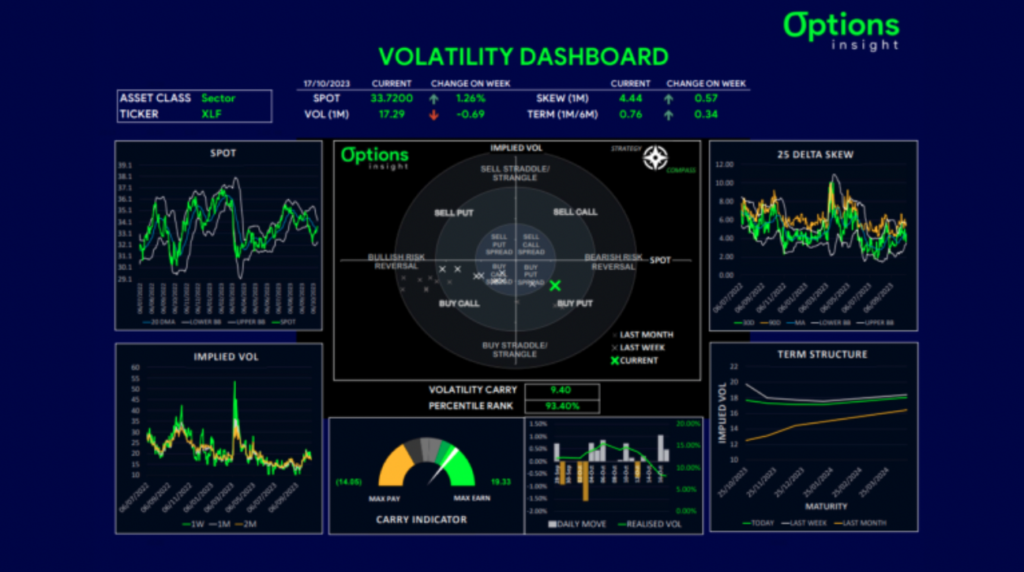
Snapshot of $XLF Vol Dashboard:
Interested in learning the process/tools I follow, from thesis to trade idea? Join our next Free Options Trading Webinar
Looking across the various assets on the volatility dashboard, I noticed that XLF had the most positive carry at over 50%. This means that implied vol was nearly double realized vol, and so being short GAMMA looked very attractive as a way to earn THETA.
I, therefore, looked for iron condors to add to our books as the trade idea shared with subs.
Rates vol is the primary driver of cross-asset vol, and until it subsides, equities will be capped. Even though the FED hiking cycle is being priced as near finished, the fact that rates vol is almost as high as the SVB, shows that there are large problems.
Snapshot of $TLT vol:
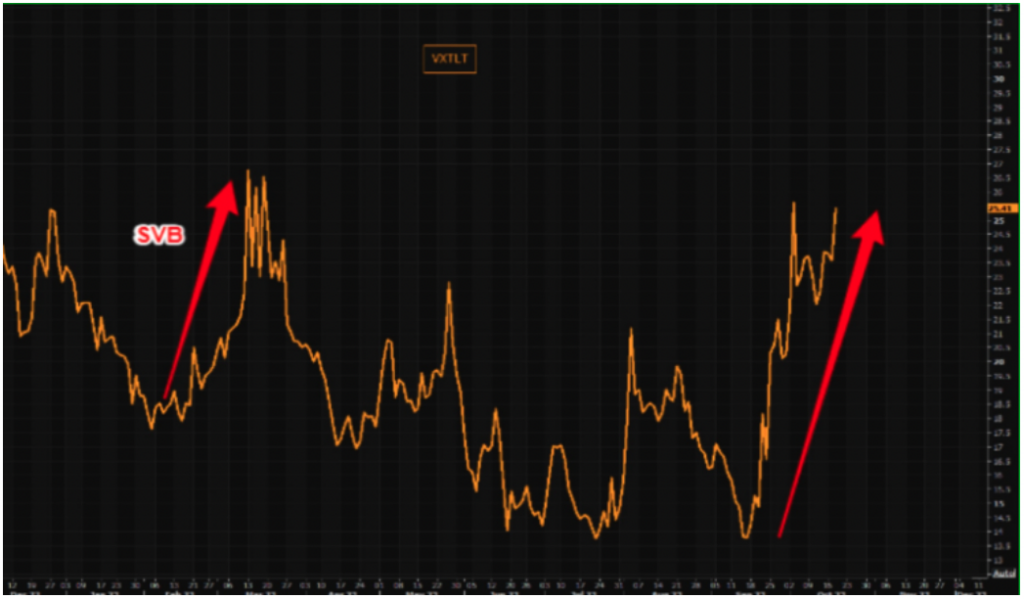
The long end of the curve has been picking up volatility as a vicious bear steepening took hold, and term premium also seems to be moving higher, bringing into question the creditworthiness of the US government. Investors are demanding higher yields to take on more US debt.
The sharp rise in yields has not been echoed in inflation expectations, so real yields are also flying high, back to 2.50%. Generally, P/E multiples tend to track real yields over time, so the current dislocation suggests that stocks are vulnerable to a repricing lower.
Snapshot of SP500 frwd PE multiple vs 10y real yield:
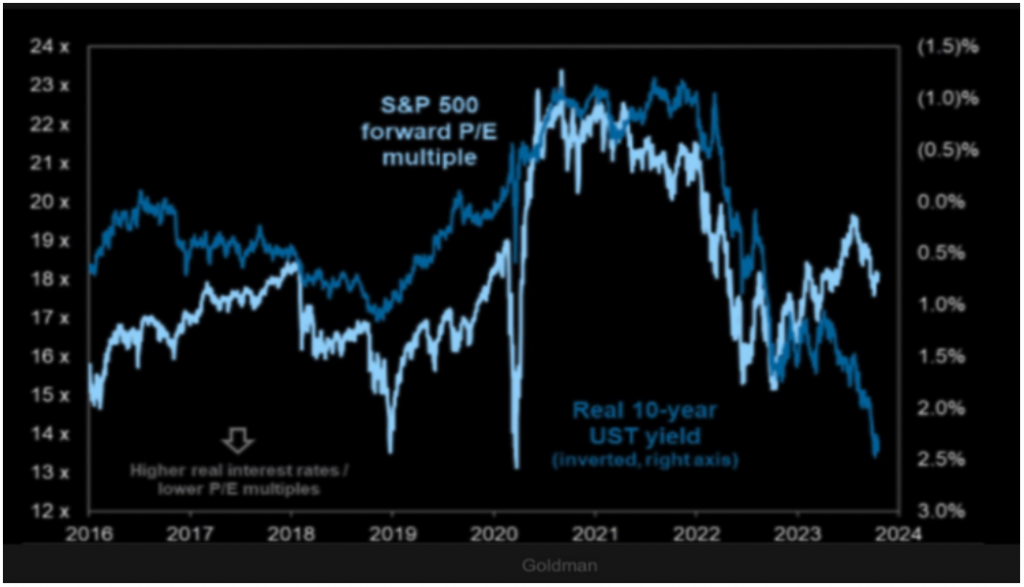
Some people are drawing parallels to 1987, when the market crashed, and while I am certainly not calling for that, we must be aware of all the tail risks out there. Buying dips in stocks works, until it doesn’t!
After a strong bullish reaction from 4200 on SPX, I thought the next leg of the bull run had started, and the year-end chase could begin. The move in bond yields back to highs and the Middle East conflict has questioned that scenario, at least in the short term.
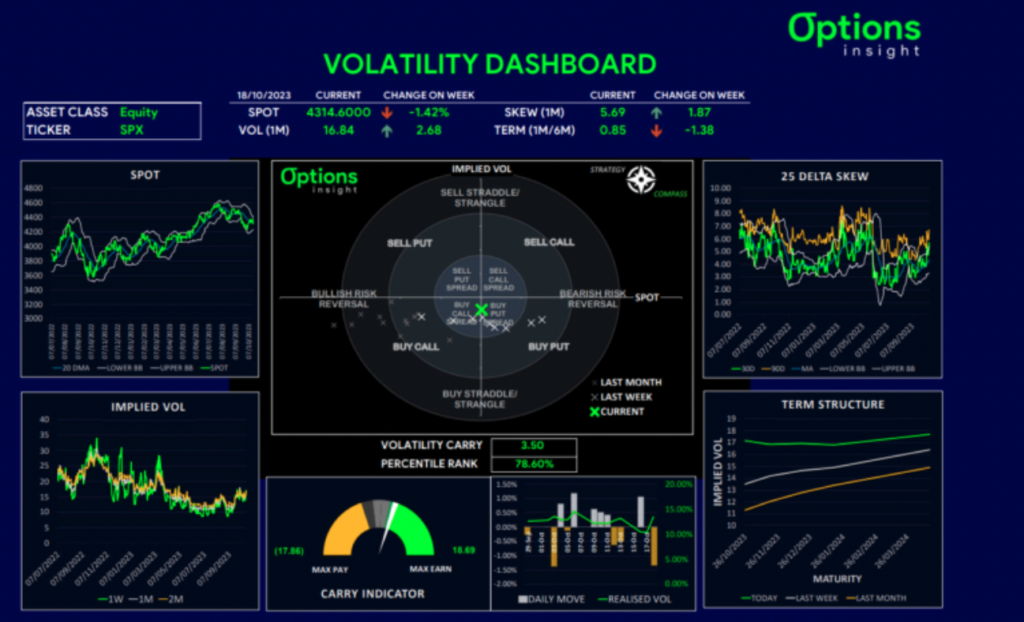
Implied vol has risen moderately, and skew has spiked into the 70th percentile on SPX. Looking at the chart, I wonder, what if the 4200 level does break? In my opinion, a slide to 4000 cannot be ruled out even if it is likely to be short-lived.
With mid-level vol and high skew, those needing protection should look at put spreads, which still offer decent risk/reward. For those subscribed to the service, that’s precisely the trade idea I proposed in my Friday note.
With implied vol failing to spike that much, as realized remains contained, but skew getting expensive again, using put spreads to hedge downside is optimal for those unhedged. I would, however, be wary of selling upside as markets can snap back quickly on de-escalation.
Snapshot of $SPX Vol Dashboard:
Interested in learning the process/tools I follow, from thesis to trade idea? Join our next Free Options Trading Webinar
Remember, not only do I share these trade ideas, but the ones I end up adding to my portfolio, are then tracked via a 20-30m weekly webcast that gives in-depth guidance. In it, you get to learn how to break down options trades by their Greeks and restructure trades in an optimal way to meet desired investment goals in real time. This is part of our Macro Options Overlay.
Remember, you now have a chance to build your knowledge base via our FREE Options Insight webinar!
You will learn the process and tools I follow, from thesis to trade idea and actual execution.
This is a unique chance to learn how to master simple options trading strategies straight from a 20+ year career.
σ
σ
Thank you for making it this far!
As always, if you have any questions, comments, and/or found this helpful, feel free to reach out and let us know at info@options-insight.com
Cheers!
Imran Lakha
Options Insight
