The volatility skew as a conditional statement

The volatility skew is a conditional statement. Every point on it is the market's expected vol if the underlying actually gets to that strike.
Read that way, the whole shape suddenly makes sense.
The implied vol on a strike 20% below the market is the vol we would have if we fell 20%. It bakes in a specific scenario. A crash to that level, fast, with the panic and forced selling that usually accompanies that kind of move.
The implied vol on a strike 5% above the market is a different scenario. A rally, probably calmer, more orderly. So the number is lower.
Same underlying. Two different implied vols. Why? Because two different worlds are priced into the same surface.
That's why equity skew has the shape it does. Equity markets typically crash down and grind up. The market's expected behaviour in the two directions is asymmetric, so the vol priced for each direction is asymmetric too.
The supply-demand piece is real. Puts are in structural demand because people want crash protection. But that demand exists because of what the market thinks a drop actually looks like.
Supply and demand are the messenger. The scenario the market imagines is the message.
In equities, a crash is the scary scenario. Skew leans toward puts. In assets where a squeeze higher is the scary scenario (commodities in a supply shock, short-heavy stocks, VIX), the curve leans the other way. Same conditional logic. Different scenario at the tail.
Right now, SPX skew flattened to extremes on the last two-day rip. That's the market changing its mind about what a further rally would look like.
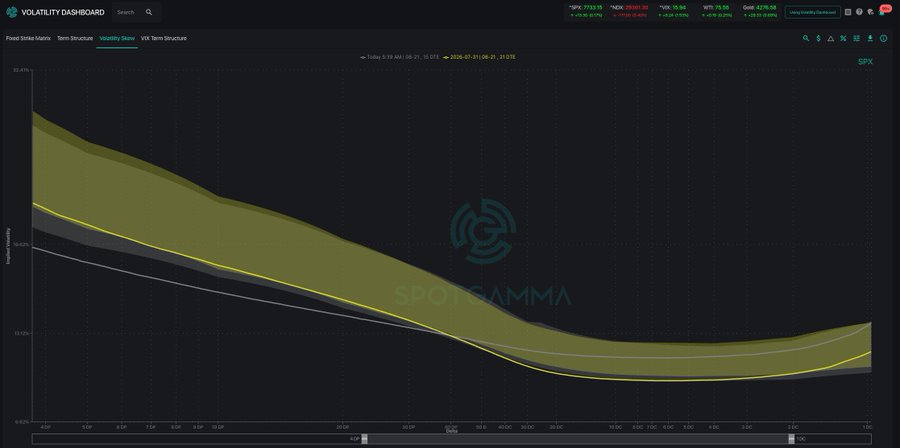
Which brings us to the bigger point.
When the skew shifts, the market has changed its mind about what a directional move looks like. The price of insurance moves. The scenario the insurance is priced against moves with it.
That's what makes skew shifts worth watching. Each shift is a worldview update. The market is telling you what it thinks a move in that direction now looks like.
For more insights into the framework I built across 20 years on bank options desks, check the link below.
Every asset has a skew shape that tells you where the market sees tail risk.
Equities lean towards puts. VIX has an aggressive upside skew because a spike is always the scary scenario. Commodities under supply pressure lean towards calls. Currency pairs bend depending on which side of the trade the pain would come from. Once you know how to read the shape, you can look at any asset's skew and immediately understand what the market is bracing for.
Every point on the skew is trying to calibrate what a move in that direction actually feels like. Read it that way and the surface starts telling you things the price chart never will.
If you want to skip the masterclass and jump straight into our course, the Options Insight Advantage, this is the link.

Imran
Disclaimer (Your Gains & Losses, Your Responsibility): This content from Options Insight LLC (“Options Insight”) is for educational purposes only and does not provide individual investment advice or recommendations, nor should it be considered an offer to buy or sell any security. All information is general and not tailored to your specific objectives, financial situation, or risk tolerance. Employees of Options Insight may hold positions in the assets discussed. While we use sources believed to be reliable, we are not responsible for errors, omissions, or losses resulting from reliance on this content. Always consult a licensed investment professional.
Liked this? Imran writes one every market day. Get them direct to your inbox.